Charts
ZigZag
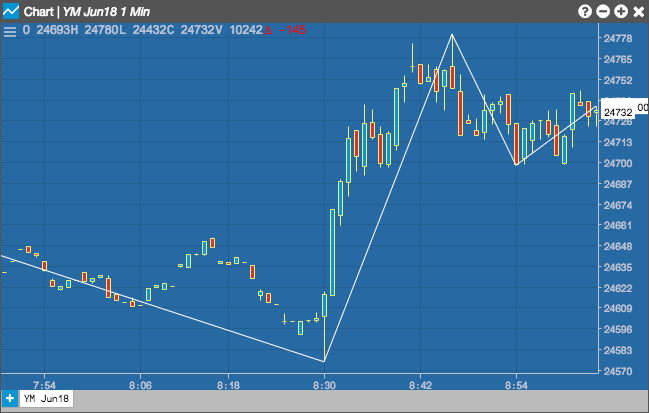
The ZigZag indicator can be used to determine a reversing market trend. The indicator determines support and resistance levels on the chart based on a percentage of reversing price movements. The percentage of price movement is user-defined and the value can be used to filter out smaller price fluctuations.
Configuration Options
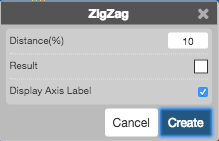
- Distance (%): Minimum price fluctuation threshold to display in the chart.
- Color Selectors: Colors to use for graph elements.
- Display Axis Label: Whether to display the most recent value on the Y axis.