Charts
VWAP
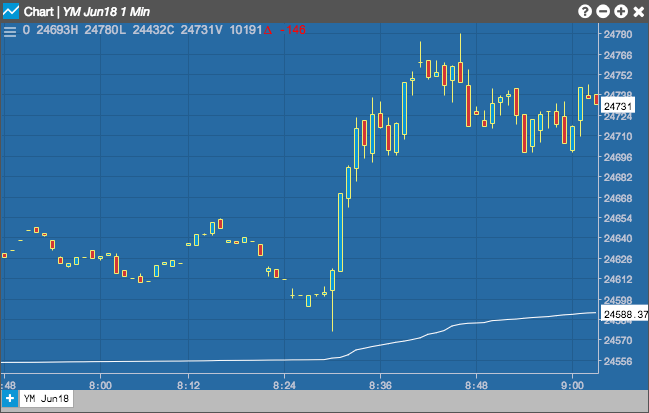
The Volume Weighted Average Price indicator (VWAP) shows the intraday average traded price of an instrument based on both volume and price. In addition, you can use the indicator to calculate up to three standard deviations from the VWAP and display them in the Chart.
Note: You cannot apply the VWAP technical indicator to Price Distribution and Tick charts. VWAP applied to a spread chart is based on price updates to the spread chart. Each price update on either leg of a spread chart is assigned a volume value of one.
Configuration Options
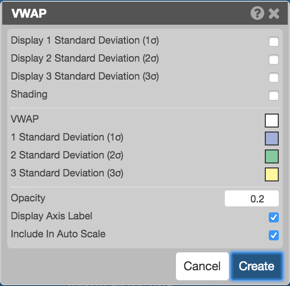
- Display 1 Standard Deviation (σ): Displays price bands one standard deviation from VWAP
- Display 2 Standard Deviation (σ): Displays price bands two standard deviations from VWAP
- Display 3 Standard Deviation (σ): Displays price bands three standard deviations from VWAP
- Shading: Displays shading between bands
- VWAP (line color)
- 1 Standard Deviation (σ): Sets the color of the first standard deviation band
- 2 Standard Deviation (σ): Sets the color of the second standard deviation band
- 3 Standard Deviation (σ): Sets the color of the third standard deviation band
- Opacity: Opacity of the shading
- Display Axis Label: Whether to display the most recent value on the Y axis.
- Include in auto scale: Adjusts the price ladder to show all VWAP indicators.
Formula
\[ VWAP = \frac{Cumulative(Volume * Typical Price)}{Cumulative(Volume)} \]