Charts
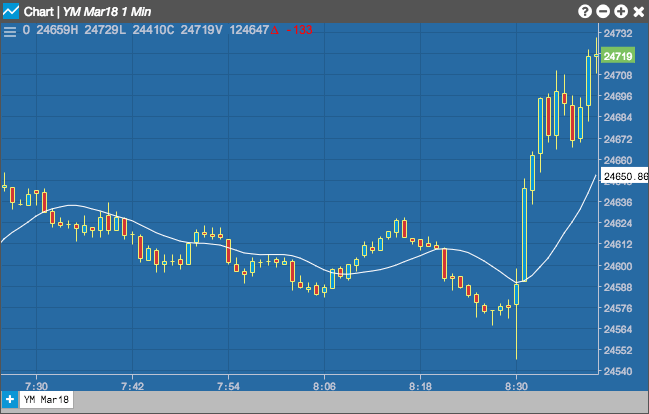
Typical Price
The Typical Price indicator takes the simpgle average between the close, high, and low prices.
Selecting the Typical Price indicator allows you to set the Period (as number of minutes), whether the indicator displays as an Overlay on the chart, and the color of the result.
Configuration Options
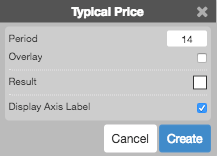
- Period: Number of bars to use in the calculations.
- Overlay: Whether to display the curve on top of the graph instead of below the graph.
- Color Selectors: Colors to use for graph elements.
- Display Axis Label: Whether to display the most recent value on the Y axis.
Formula
The Typical Price indicator adds the high, low, and close prices. The total is then averaged (i.e., divided by a factor of 3).
\[ TP = \frac{Close + High + Low}{3}\]