Charts
RAVI
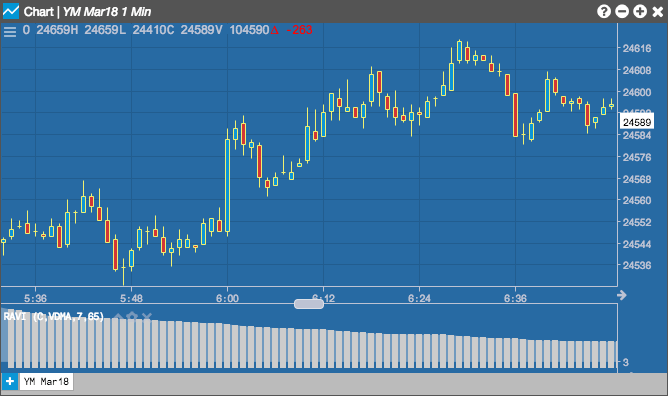
The RAVI indicator shows the percentage difference between current prices and past prices to identify market trends. It is calculated based on moving averages of different lengths.
Configuration Options
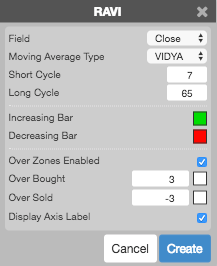
- Field: Price or combination of prices to use as the base for average calculations. Possible values include:
- Open
- High
- Low
- Close
- Adjusted Close
- HL/2 \( \left ( \frac{High + Low}{2} \right ) \)
- HLC/3 \( \left ( \frac{High + Low + Close}{3} \right ) \)
- HLCC/4 \( \left ( \frac{High + Low + Close + Close}{4} \right ) \)
- OHLC/4 \( \left ( \frac{Open + High + Low + Close}{4} \right ) \)
- Moving Average Type: Type of moving average to use in the calculations:
- Simple: Mean (average) of the data.
- Exponential: Newer data are weighted more heavily geometrically.
- Time Series: Calculates a linear regression trendline using the “least squares fit” method.
- Triangular: Weighted average where the middle data are given the most weight, decreasing linearly to the end points.
- Variable: An exponential moving average with a volatility index factored into the smoothing formula. The Variable Moving average uses the Chande Momentum Oscillator as the volatility index.
- VIDYA: An exponential moving average with a volatility index factored into the smoothing formula. The VIDYA moving average uses the Standard Deviation as the volatility index. (Volatility Index DYnamic Average).
- Weighted: Newer data are weighted more heavily arithmetically.
- Welles Winder:The standard exponential moving average formula converts the time period to a fraction using the formula EMA% = 2/(n + 1) where n is the number of days. For example, the EMA% for 14 days is 2/(14 days +1) = 13.3%. Wilder, however, uses an EMA% of 1/14 (1/n) which equals 7.1%. This equates to a 27-day exponential moving average using the standard formula.
- Hull: The Hull Moving Average makes a moving average more responsive while maintaining a curve smoothness. The formula for calculating this average is as follows: HMA[i] = MA( (2*MA(input, period/2) – MA(input, period)), SQRT(period)) where MA is a moving average and SQRT is square root.
- Double Exponential: The Double Exponential moving average attempts to remove the inherent lag associated to Moving Averages by placing more weight on recent values.
- Triple Exponential: TBD
- Simple
- Exponential
- Time Series
- Triangular
- Variable
- VIDYA
- Weighted
- Welles Winder
- Hull
- Double Exponential
- Triple Exponential
- Short Cycle: Length of the long-moving average period.
- Long Cycle: Length for the short-moving average period.
- Color Selectors: Colors to use for graph elements.
- Over Zones Enabled: Whether to shade the area between the plot and the horizontal overbought and oversold levels.
- Over Bought: Overbought quantity
- Over Sold: Oversold quantity
- Display Axis Label: Whether to display the most recent value on the Y axis.
Formula
\[ RAVI = \frac{100 * (n{\text -}period\;short\;moving\;average - n{\text -}period\;long\;moving\;average)}{n{\text -}period\;long\;moving\;average} \]