Charts
Rainbow Moving Average
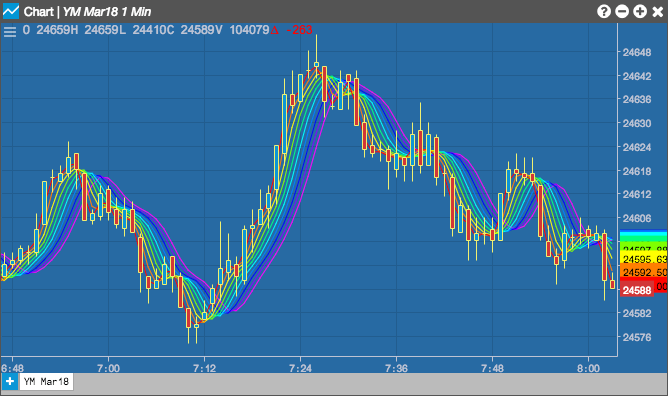
The Rainbow Moving Average indicator shows multiple simple moving averages (SMAs) all at once for a specific time period. Each SMA is calculated based on the previous SMA and is color-coded in the chart.
Configuration Options
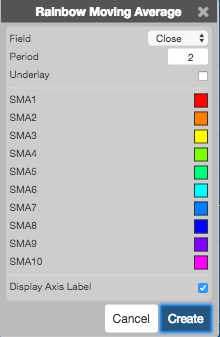
- Field: Price or combination of prices to use as the base for average calculations. Possible values include:
- Open
- High
- Low
- Close
- Adjusted Close
- HL/2 \( \left ( \frac{High + Low}{2} \right ) \)
- HLC/3 \( \left ( \frac{High + Low + Close}{3} \right ) \)
- HLCC/4 \( \left ( \frac{High + Low + Close + Close}{4} \right ) \)
- OHLC/4 \( \left ( \frac{Open + High + Low + Close}{4} \right ) \)
- Period: Number of bars to use in the calculations.
- Underlay: Whether to display the curve behind the graph.
- Color Selectors: Colors to use for graph elements.
- Display Axis Label: Whether to display the most recent value on the Y axis.
Formula
\[Simple = MA = \frac{\sum_{i=1}^{n} Close_{i}}{n}\]