Charts
Price Volume Trend (PVT)
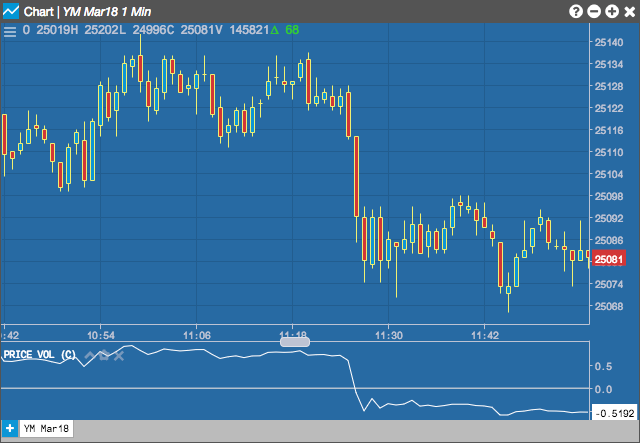
The Price Volume Trend (PVT) study attempts to quantify the amount of volume flowing into or out of an instrument by identifying the close of the period in relation to the previous period's close. The volume for the period is then added to a running continuous total.
Configuration Options
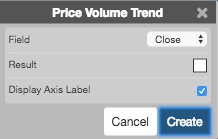
- Field: Price or combination of prices to use as the base for average calculations. Possible values include:
- Open
- High
- Low
- Close
- Adjusted Close
- HL/2 \( \left ( \frac{High + Low}{2} \right ) \)
- HLC/3 \( \left ( \frac{High + Low + Close}{3} \right ) \)
- HLCC/4 \( \left ( \frac{High + Low + Close + Close}{4} \right ) \)
- OHLC/4 \( \left ( \frac{Open + High + Low + Close}{4} \right ) \)
- Color Selectors: Colors to use for graph elements.
- Display Axis Label: Whether to display the most recent value on the Y axis.
Formula
\[ PVT = \left ( \frac{Close_{current} - Close_{previous}}{Close_{previous}} \right ) + PVT_{previous}\]