Charts
Pivot Points
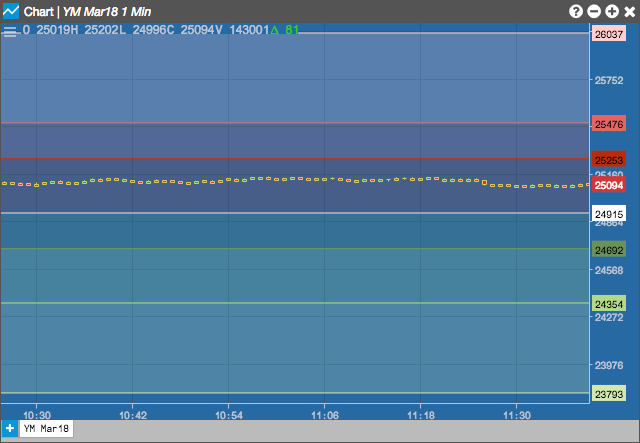
The Pivot Points indicator is used to identify intraday support, resistance and targets. The pivot point itself is the average of the high, low and closing prices from the previous trading period. On the subsequent period, trading above the pivot point is thought to indicate ongoing bullish sentiment, while trading below the pivot point indicates bearish sentiment.
This indicator plots seven horizontal lines for each period, one for Pivot line, three for Support and three for Resistance
Period is determined as follows:
- Daily: Intraday chart from 1 minute up to but not including 30 minutes
- Weekly: Intraday chart from 30 minutes upwards
- Monthly: Daily charts
- Yearly: Weekly and monthly charts
Daily periods begin at times specified by the exchange.
Configuration Options
-
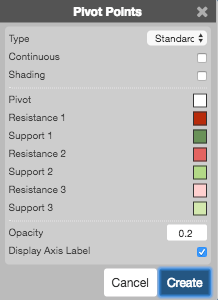
Type: Type of pivot points to use:
- Standard
- Fibonacci
- Continuous:
- Shading: Whether to shade the zones between pivot levels.
- Color Selectors: Colors to use for graph elements.
- Opacity: Opacity of the shading
- Display Axis Label: Whether to display the most recent value on the Y axis.
Formula
The pivot point and its support and resistance pairs are defined as follows:
\[ Pivot\;point\;(P) = \frac{(H + L + C)}{3} \]
\[ Third\;resistance\;level\;(R3) = P + 2*(H – L) \]
\[ Second\;resistance\;level\;(R2) = P + (H – L) \]
\[ First\;resistance\;level\;(R1) = (2 * P) - L \]
\[ First\;support\; level\; (S1) = (2 * P) - H \]
\[ Second\; support\; level\; (S2) = P - (H – L)\]
\[ Third\; support\; level\; (S3) = P - 2 * (H-L) \]
where H, L, C are the previous period’s high, low and close