Charts
Money Flow Index (MFI)
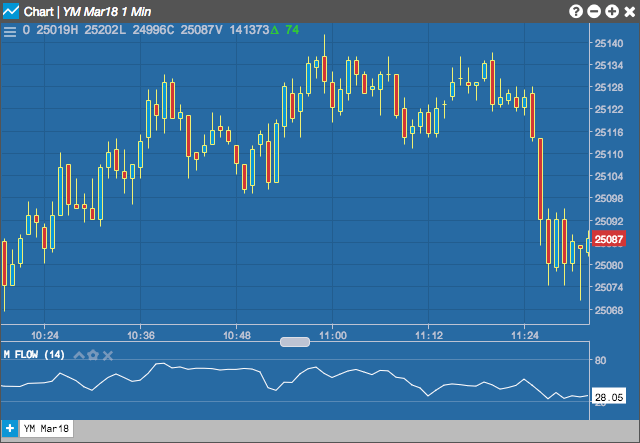
The Money Flow Index (MFI), developed by Gene Quong and Avrum Soudack, uses both price and volume to measure buying and selling pressure. The MFI value ranges from 0 to 100. A MFI value above 80 indicates a possible overbought situation and a value below 20 indicates a possible oversold condition.
Configuration Options
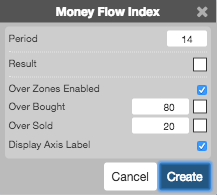
- Period: Number of bars to use in the calculations.
- Color Selectors: Colors to use for graph elements.
- Over Zones Enabled: Whether to shade the area between the plot and the horizontal overbought and oversold levels.
- Over Bought: Overbought quantity
- Over Sold: Oversold quantity
- Display Axis Label: Whether to display the most recent value on the Y axis.
Formula
The formula is essentially a volume-weighted relative strength index (RSI). However, instead of using simple close prices, MFI uses the typical price multiplied by volume. The result is then used in the RSI calculation as a ratio of average volume weighted size of the up-closes over the past “n” periods and compared to the average volume weighted size of the down-closes. The result is indexed between 0 and 100.
\[Pivot = \frac{(High + Low + Close)}{3}\]
\[MF = Money\;Flow = \begin{pmatrix} if\;Pivot_{t} > Pivot_{t-1}, & Pivot \times Volume \\ if\;Pivot_{t} < Pivot_{t-1}, & -Pivot \times Volume & \end{pmatrix} \]
\[MR = Money\;Ratio = \frac{\sum_{1}^{n} Positive\;MF}{\sum_{1}^{n} Negative\;MF}\]
over a user defined n-periods
\[MFI = 100 - \frac{100}{1+ MR_{n-periods}} \]