Charts
Median Price (MP)
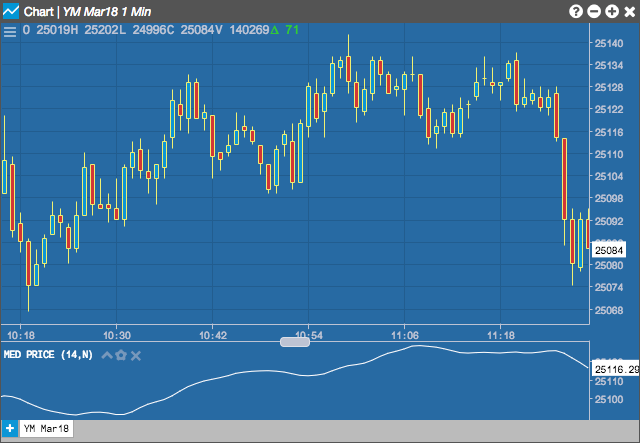
The Median Price (MP) indicatior shows the median price for a range of prices by averaging the high and low values of the analyzed interval.
Configuration Options
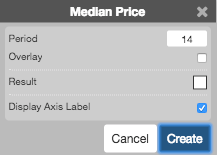
- Period: Number of bars to use in the calculations.
- Overlay: Whether to display the curve on top of the graph or in a separate bottom section.
- Color Selectors: Colors to use for graph elements.
- Display Axis Label: Whether to display the most recent value on the Y axis.
Formula
\[MP = \frac{High + Low}{2} \]