Charts
MACD
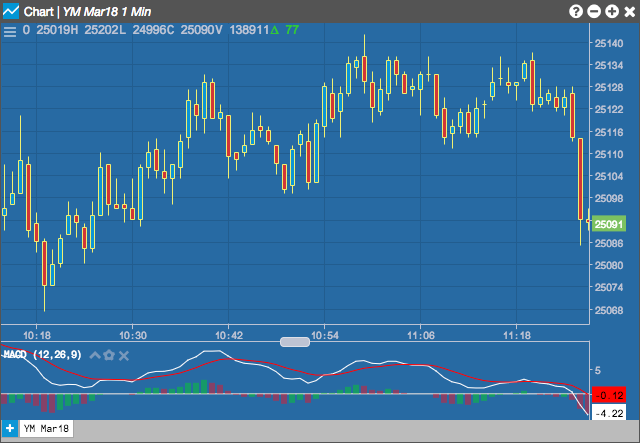
The Moving Average Convergence Divergence (MACD) indicator is based on the differences between two moving averages of different lengths, a Fast and a Slow moving average. A second line, called the Signal line is plotted as a moving average of the MACD. A third line, called the MACD Histogram is optionally plotted as a histogram of the difference between the MACD and the Signal Line. It is used to identify overbought and oversold conditions.
Typically, a MACD line that has a rising trend and is above the Signal Line indicates a bullish market. Conversely, a bearish market is often indicated when a MACD line is falling and is below the Signal Line. Buy signals are given when the MACD crosses above the signal; similar to price crossing above a moving average. Sell signals are given when the MACD crosses below the signal.
Configuration Options
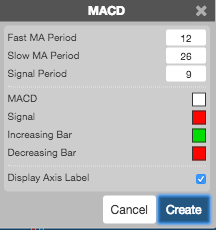
- Fast MA Period: Number of periods in the fast moving average.
- Slow MA Period: Number of periods in the slow moving average.
- Signal Period: Number of periods in exponential moving average of the MACD line.
- Color Selectors: Colors to use for graph elements.
- Display Axis Label: Whether to display the most recent value on the Y axis.
Formula
\[MACD = FastMA - SlowMA\]
where:
- FastMA is the shorter moving average and SlowMA is the longer moving average.
- SignalLine = MovAvg(MACD)
- MACD Histogram = MACD- SignalLine