Charts
Linear Regression Slope (LRS)
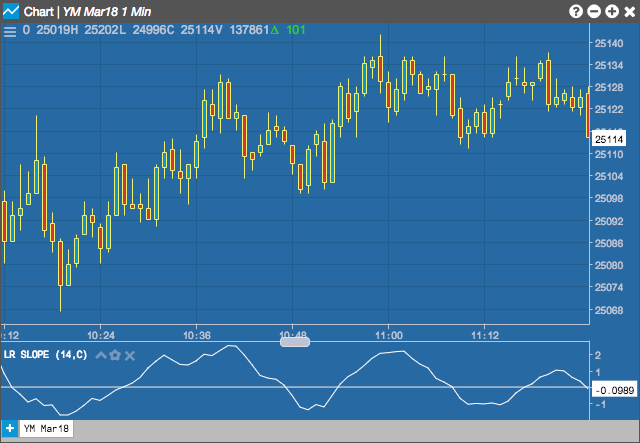
Linear regression is a statistical tool used to help predict future values from past values. It is commonly used as a quantitative way to determine the underlying trend and when prices are overextended. A linear regression trendline uses the least squares method to plot a straight line through prices so as to minimize the distances between the prices and the resulting trendline. This linear regression indicator plots the slope of the trendline value for each given data point.
Configuration Options
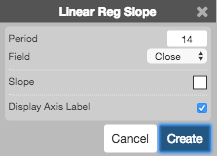
- Period: Number of bars to use in the calculations.
- Field: Price or combination of prices to use as the base for average calculations. Possible values include:
- Open
- High
- Low
- Close
- Adjusted Close
- HL/2 \( \left ( \frac{High + Low}{2} \right ) \)
- HLC/3 \( \left ( \frac{High + Low + Close}{3} \right ) \)
- HLCC/4 \( \left ( \frac{High + Low + Close + Close}{4} \right ) \)
- OHLC/4 \( \left ( \frac{Open + High + Low + Close}{4} \right ) \)
- Color Selectors: Colors to use for graph elements.
- Display Axis Label: Whether to display the most recent value on the Y axis.
Formula
The best fit line associated with the n points (x1, y1), (x2, y2), . . . , (xn, yn) has the form y = mx + b
\[slope\;=\;m\;=\;\frac{\sum_{i=1}^{n}(x_{i} - \bar{x})(y_{i} - \bar{y})}{\sum_{i=1}^{n}(x_{i} - \bar{x})^{2}}\]
\[intercept\;=\;b\;=\;\bar{y} - m\bar{x}\]