Charts
Donchian Channel
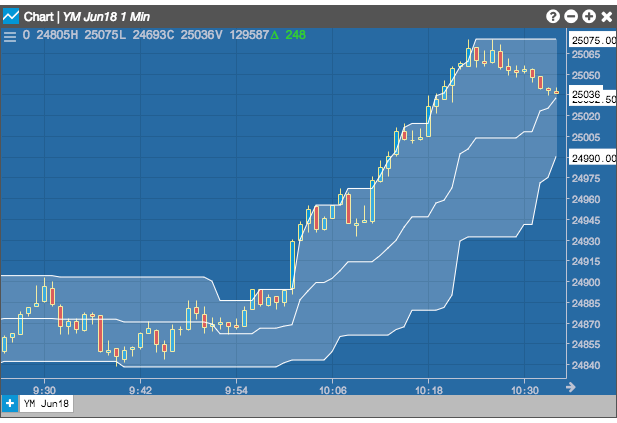
The Dochian Channel indicator creates a channel between the highest high price and lowest low price for the previous user-defined number of bars. The width of the channel helps visualize the volatility of the market price. If the price fluctuates a lot, the channel will be wider. Converely, when the price moves less, the channel will be narrower. The center line tracks the midpoint between the bands.
Configuration Options
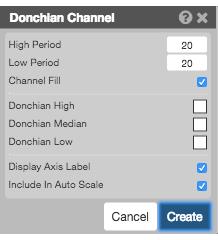
- High Period: Number of bars to use for the highest high price.
- Low Period: Number of bars to use for the lowest low price.
- Channel Fill: Whether to shade the region between the upper and lower bands.
- Color Selectors: Colors to use for graph elements.
- Display Axis Label: Whether to display the most recent value on the Y axis.
- Include In Auto Scale:
Formula
The Donchian Channel uses the following formulas:
- \( DC_{upper} = High_{n-periods} \)
- \( DC_{lower} = Low_{n-periods} \)
- \( DC_{middle} = \frac {DC_{upper} + DC_{lower}}{2} \)