Charts
Correlation Coefficient
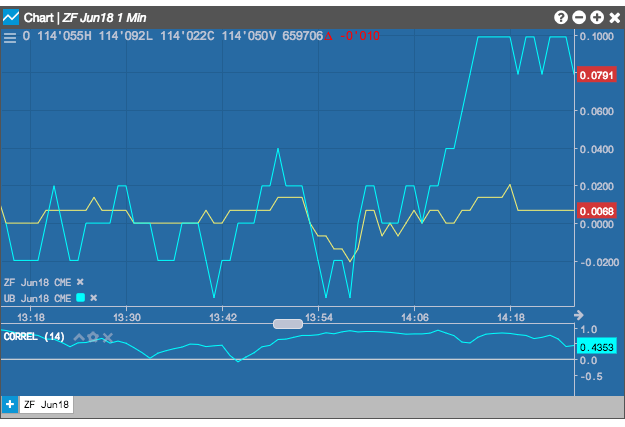
The Correlation Coefficient indicator helps identify the level of correlation between multiple instruments. When two instruments trend in the same direction, whether higher or lower, a stronger positive correlation is indicated. Likewisem, when the prices of the instruments trend in opposite directions, a stronger negative correlation is indicated. The correlation fluctuates between -1 and 1, with 0 meaning no correlation exists between the instruments.
Note: The Correlation Coefficient indicator is valid only when comparing multiple instruments using either Comparisons or Series. When more that two instruments are used, each correlation indicator is compared to the chart's first instrument.
Configuration Options
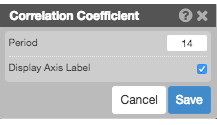
- Period: Number of bars to use in the calculations.
- Color Selectors: Colors to use for graph elements.