Charts
Chande Momentum Oscillator (CMO)
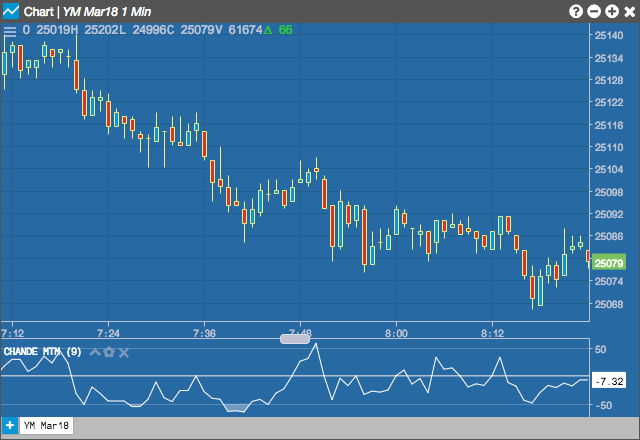
The Chande Momentum Oscillator (CMO) attempts to capture the momentum of the instrument. The indicator oscillates between -100 and 100 with overbought level of 50 and oversold level of -50.
Configuration Options
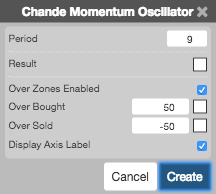
- Period: Number of bars to use in the calculations.
- Color Selectors: Colors to use for graph elements.
- Over Zones Enabled: Whether to shade the area between the plot and the horizontal overbought and oversold levels.
- Over Bought: Overbought quantity
- Over Sold: Oversold quantity
- Display Axis Label: Whether to display the most recent value on the Y axis.
Formula
\[CMO = \left (\frac{PosSum - NegSum}{PosSum + NegSum} \right )\times 100\]
where:
\[PosSum = \sum (Close_{current}\;-\;Close_{previous})\;when\;(Close_{current}\;-\;Close_{previous}) > 0\]
\[NegSum = \sum \left | (Close_{current}\;-\;Close_{previous}) \right |\;when\;(Close_{current}\;-\;Close_{previous}) < 0\]