Charts
Chaikin Volatility (CV)
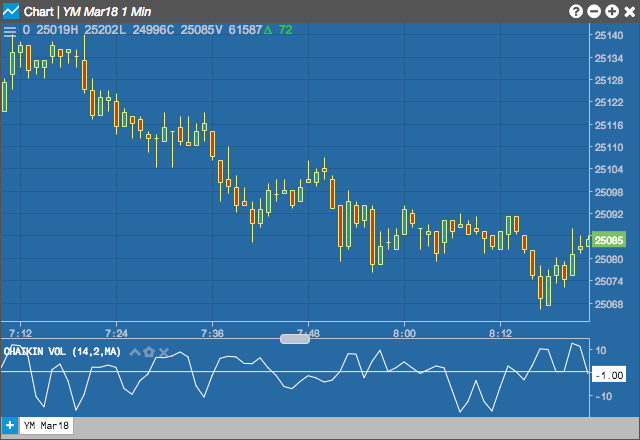
The Chaikin Volatility, developed by Marc Chaikin, uses the bar range to measure volatility by comparing the differences between the high and low prices using a standard rate of change formula. The Chaikin curve oscillated -100% and +100% of the difference, with values below 0 indicating lower volatility and values above 0 indicating higher volatility.
Configuration Options
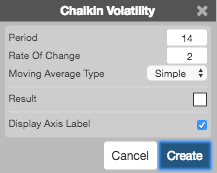
- Period: Number of bars to use in the calculations.
- Moving Average Type: Type of moving average to use in the calculations:
- Simple: Mean (average) of the data.
- Exponential: Newer data are weighted more heavily geometrically.
- Time Series: Calculates a linear regression trendline using the “least squares fit” method.
- Triangular: Weighted average where the middle data are given the most weight, decreasing linearly to the end points.
- Variable: An exponential moving average with a volatility index factored into the smoothing formula. The Variable Moving average uses the Chande Momentum Oscillator as the volatility index.
- VIDYA: An exponential moving average with a volatility index factored into the smoothing formula. The VIDYA moving average uses the Standard Deviation as the volatility index. (Volatility Index DYnamic Average).
- Weighted: Newer data are weighted more heavily arithmetically.
- Welles Winder:The standard exponential moving average formula converts the time period to a fraction using the formula EMA% = 2/(n + 1) where n is the number of days. For example, the EMA% for 14 days is 2/(14 days +1) = 13.3%. Wilder, however, uses an EMA% of 1/14 (1/n) which equals 7.1%. This equates to a 27-day exponential moving average using the standard formula.
- Hull: The Hull Moving Average makes a moving average more responsive while maintaining a curve smoothness. The formula for calculating this average is as follows: HMA[i] = MA( (2*MA(input, period/2) – MA(input, period)), SQRT(period)) where MA is a moving average and SQRT is square root.
- Double Exponential: The Double Exponential moving average attempts to remove the inherent lag associated to Moving Averages by placing more weight on recent values.
- Triple Exponential: TBD
- Simple
- Exponential
- Time Series
- Triangular
- Variable
- VIDYA
- Weighted
- Welles Winder
- Hull
- Double Exponential
- Triple Exponential
- Rate Of Change: TBD
- Color Selectors: Colors to use for graph elements.
- Display Axis Label: Whether to display the most recent value on the Y axis.
Formula
\[Chaikin\;Volatility = \left ( \frac{\left (High-Low\;Average)_{current} - (High-Low\;Average)_{n-periods\;ago} \right )}{(High-Low\;Average)_{n-periods\;ago}} \right )\times 100\]
where:
\[(High-Low\;Average)= Exponential\;moving\;average\;of\;(High - Low)\; for\;n\text{-}periods\]