Charts
ATR Bands
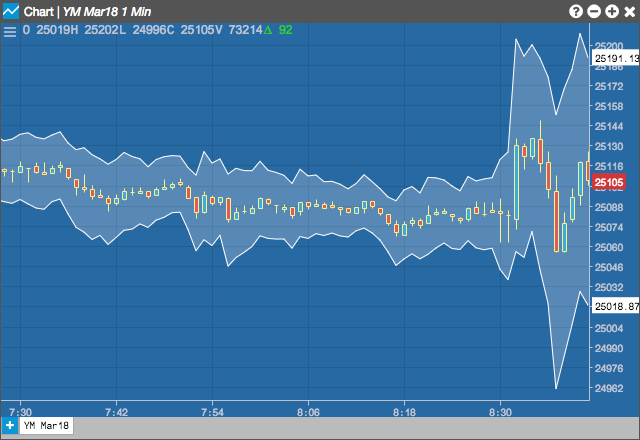
The ATR Bands indicator shows trends in price movements. Based on the average true range (ATR), the ATR bands are plotted around the ATR values to indicate the direction of movements in price.
Configuration Options
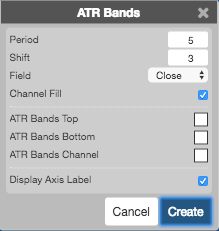
- Period: Number of bars to use in the calculations.
- Shift: Number of ATR multiples to draw the bands above and below the ATR.
- Field: Price or combination of prices to use as the base for average calculations. Possible values include:
- Open
- High
- Low
- Close
- Adjusted Close
- HL/2 \( \left ( \frac{High + Low}{2} \right ) \)
- HLC/3 \( \left ( \frac{High + Low + Close}{3} \right ) \)
- HLCC/4 \( \left ( \frac{High + Low + Close + Close}{4} \right ) \)
- OHLC/4 \( \left ( \frac{Open + High + Low + Close}{4} \right ) \)
- Channel Fill: Whether to shade the area between the bands.
- Color Selectors: Colors to use for graph elements.
- Display Axis Label: Whether to display the most recent value on the Y axis.
Formula
ATR Bands take multiples of the ATR and plot them as bands above and below the ATR line.