Charts
Accumulation Distribution (ACC Dist)
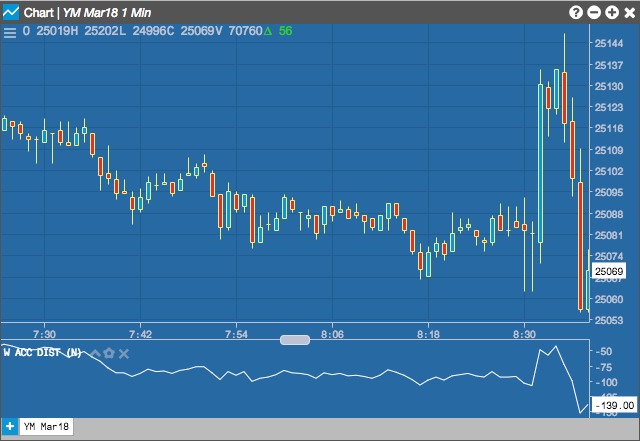
The Accumulation/Distribution (AD) indicator attempts to quantify the amount of volume flowing into or out of an instrument by identifying the position of the close of the period in relation to that period’s high/low range. The volume for the period is then included in a running continuous total.
Configuration Options
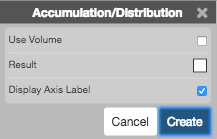
- Use Volume: Whether to use trade volume in the formula calculation.
- Color Selectors: Colors to use for graph elements.
- Display Axis Label: Whether to display the most recent value on the Y axis.
Formula
\[AD = cumulative \left ( \frac{(Close - Low) - (High -Close)}{(High - Low)} \times Volume \right )\]